The KDK collaboration validates their experimental method and testing, and are ready to measure the elusive 40K decay channel
The electron capture decay channel of 40K to ground state 40Ar has never been experimentally observed and has a wide range of theoretically proposed decay rates. Having an accurate measurement of the decay rate will lead to improved background characterization for rare event searches using NaI crystal scintillators, and is also of interest to geochronology.
McDonald Instant Overview (1 minute read)
- Potassium-40 (40K) is an unstable isotope whose decay scheme is known but not all channels have been experimentally observed and verified. Specifically, the electron capture decay channel to ground state Argon-40 (40Ar) has a wide range of theoretically estimated decay rates but has not been observed experimentally.
- Rare event searches that use sodium iodine (NaI) crystal scintillators, such as ANAIS, COSINE-100, COSINUS, DM-Ice17, PICO-LON, SABRE, and DAMA/LIBRA, are expected to have uncharacterized 40K background contributions from potassium contamination in the crystals due to the chemical similarities of sodium and potassium. The decay of 40K is also relevant to geochronology.
- The KDK collaboration has designed, commissioned, and characterized an experiment to robustly measure the electron capture decay of 40K to ground state 40Ar. The upcoming results of this experiment and complementary methods also being designed, commissioned, and characterized by KDK will assist in the background characterization of rare event searches.
What is KDK?
The Potassium (K) decay (DK) collaboration has built, tested, and characterized a novel detector to accurately measure the decay rates of Potassium-40 (40K) for the electron capture decay channel to ground state Argon-40 (40Ar).
40K is an unstable isotope of potassium with a very long half-life of approximately 1.4 billion years. It accounts for only 0.012% of naturally occurring potassium, with the stable isotopes 40K accounting for 93% and 40K accounting for slightly less than 7%. 40K is found in the geosphere, the biosphere (including bananas and people!), and the atmosphere. Due to its long half-life, 40K can be used for geochronological dating. The radioactivity of 40K has been analyzed and its effect on people has been found to be insignificant compared to other cancer-causing sources in our environment. More about Potassium-40.
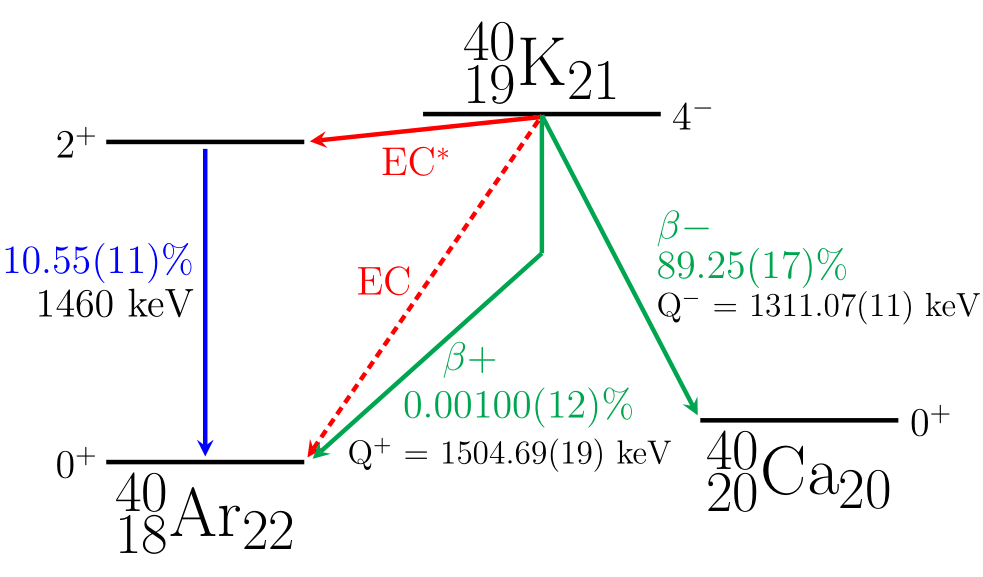 Caption: Decay scheme of 40K, Figure 1 from the 2021 KDK publication. Relative energy states are shown by black horizontal bars with the spin number and parity. Decay mechanisms are shown in green and red lines. The unobserved electron decay to the ground state of 40Ar is a dotted line to indicate it has not been experimentally verified. | The decay scheme of 40K has several channels, as seen in the image to the left. The dominant decay mechanism is 𝛽 – decay to 40Ca happening 89.25(17)% of the time. The next most likely decay channel is electron capture to an excited state of 40Ar which then de-excites to ground state 40Ar, which happens 10.55(12)% of the time. A 𝛽 + decay to the ground state of 40Ar has also been observed. Theoretically, it is possible for 40K to decay directly to the ground state of 40Ar through electron capture, but this has never been experimentally verified. The decay branching ratio for the decay channels to ground state 40Ar have been calculated, but are inconsistent and result in a branching ratio range of 0.045(12) – 0.22(4)%. Thus, a robust experimental detection and analysis is required. |
The KDK collaboration has built, tested and characterized a novel experiment to measure the 40K decay rate ratio of the decay channels to ground state 40Ar. By doing so, the decay scheme of 40K will be experimentally verified and experiments and detecting techniques across disciplines using or affected by 40K will benefit.
How would this measurement affect APP research and other fields?
The KDK collaboration’s goal and impressive progress is an important step in researching fundamental science. The verification and robust measurement of the 40K decay to the ground state of 40Ar through electron capture (from here on referred to as 40K →EC 40ArGround) gives us a better understanding of 40K and contributes to building our foundational scientific knowledge.
A more complete understanding of 40K decay is expected to contribute meaningfully across disciplines, and one key intended application for the KDK collaboration is to apply this better understanding of the decay scheme of 40K to rare event searches. In the hunt for dark matter, one of the attempted detection methods is direct detection. Direct detection involves a large detector that is active on the order of years to decades, looking for an annual modulation in signal. From theoretical predictions, the rate of dark matter passing by Earth varies as Earth orbits the Sun, with peak annual activity estimated to be on June 2.
One of the key difficulties with direct detection measurements is robustly characterizing the background so that known background sources are not mistaken for signals. Rare event searches such as ANAIS, COSINE-100, and DAMA/LIBRA use sodium iodine crystals (NaI) as scintillators. However due to the chemical similarities of sodium and potassium, these scintillators tend to have trace amounts of 40K. The decay channels of 40K contribute to the background and must be carefully identified and accounted for in these rare event searches. The unknown background from 40K →EC 40ArGround in particular is estimated to be in the 2-6 keV energy signal region for direct dark matter detection in NaI scintillating crystal detectors. The 2-6 keV energy signal region is where DAMA/LIBRA observes a modulation that is consistent with dark matter, and where experiments such as ANAIS and COSINE-100 are focusing their efforts to verify or refute this modulation as dark matter.
By confirming the decay rate of 40K →EC 40ArGround, the contribution to the background in the 2-6 keV energy signal region in NaI crystal scintillators can be better understood. This allows for better background characterization and as a direct consequence, more accurate results and improved accountability in rare event searches.
Additionally, measuring this branching ratio will have implications for geochronology and K-Ar dating. K-Ar geochronometers are generally utilized by the variant 40Ar/39Ar system, whose systematic uncertainty is partially due to the incomplete knowledge of the decay scheme of 40K. The 40Ar/39Ar method, where 39K transmutes to 39Ar by irradiation with fast neutrons, allows both parent and daughter nuclides to be measured as isotopes of Ar. The daughter nuclides are widely used to date geological events that span Earth’s history, such as volcanic eruptions and events early in the formation of the solar system.
With increasing precision of geochronology, the previously assumed insignificant contribution of 40K →EC 40ArGround may be especially significant for K-Ar dating. Having not been experimentally verified, 40K →EC 40ArGround has been omitted from consideration and its existence deemed “questionable”. Including the 40K →EC 40ArGround estimates in calculations of the decay constants for K-Ar and 40Ar/39Ar will cause ages to be younger. Calculations with K-Ar are much more sensitive to the inclusion of 40K →EC 40ArGround, with ages around 1 million years changing by as much as 2%.
What has KDK done, and how did they do it?
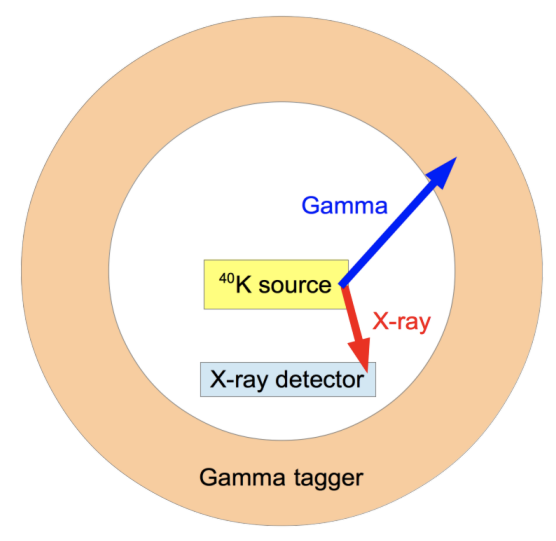 Caption: A schematic of the KDK experiment, Figure 1 from 2017 KDK conference proceedings. | KDK is finalizing their data analysis pipeline. The essence of the experiment is a two stage detector monitoring an enriched 40K source. The inner detector monitors for emitted X-rays and Auger electrons from electron capture, and the outer detector monitors for gamma rays specifically at 1.46MeV, which is the energy emitted during the de-excitation of 40Ar. This two stage method allows nearly all electron capture events to be detected and provides a way of distinguishing between the two electron capture decay channels. The first stage reveals the number of electron captures that occur, while the second stage shows how many of those decays were from excited 40Ar. The difference will reveal the number of decays that went directly to the ground state. |
In their most recent publication, the KDK collaboration showcases the specifics of the attempted and confirmed detection methods and promising first results with similar radioactive isotopes. As is further discussed in the article, the analysis has numerous considerations that complicate it significantly, and only an overview is presented here.
Two complementary but independent experimental methods were designed, commissioned, and characterized for the inner detector; a composite method which has a separate low energy detector and 40K source, and a homogenous method which has the 40K source dispersed in a bulk scintillator. Despite the high efficiency of the homogenous method, the photomultiplier tubes (PMTs) used in the reported iteration of the method were not understood to a precise enough technical detail to be used in the complete analysis. The KDK collaboration is planning to reconfigure the homogenous method for the inner detector by swapping out the current PMTs for silicon photomultipliers (SiPMs), which are better understood. Hence, the focus of the current status of the KDK experiment is on the composite method for the inner detector, which boasts high energy resolution, low energy threshold, and the ability to do dedicated background and calibration runs.
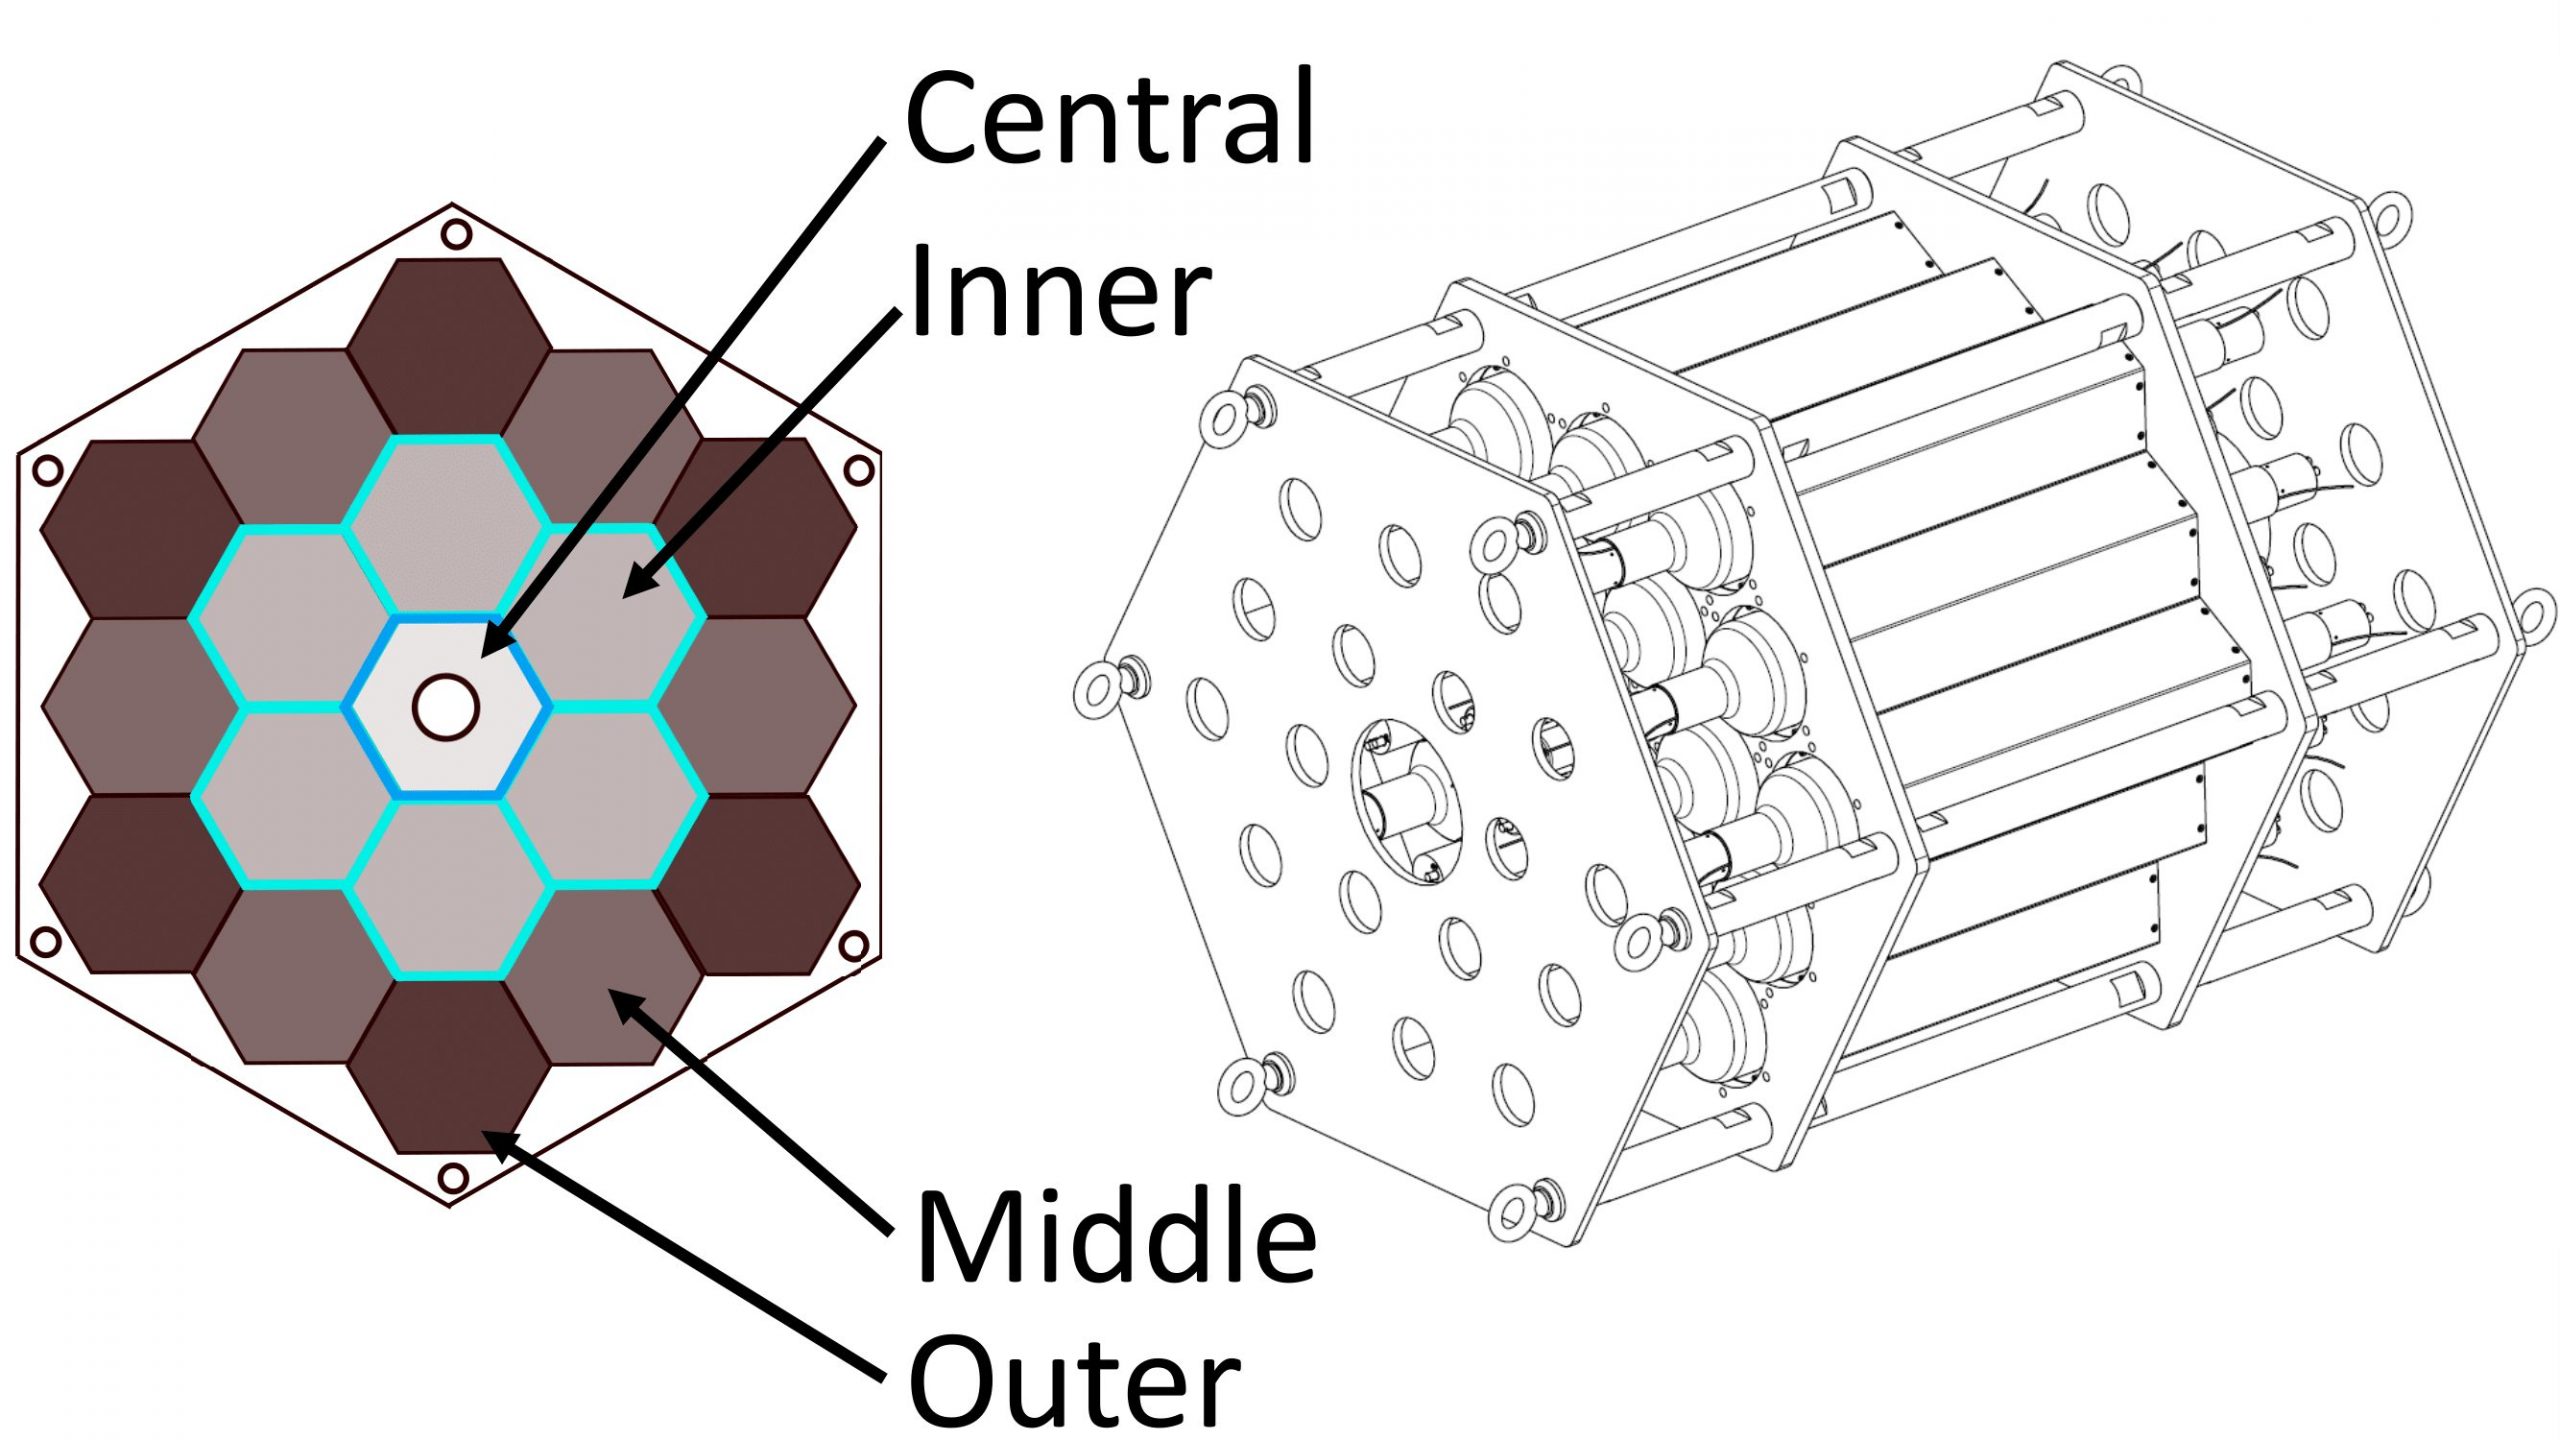 Caption: Schematic of MTAS, the outer detector. Figure 2 from the 2021 KDK publication.
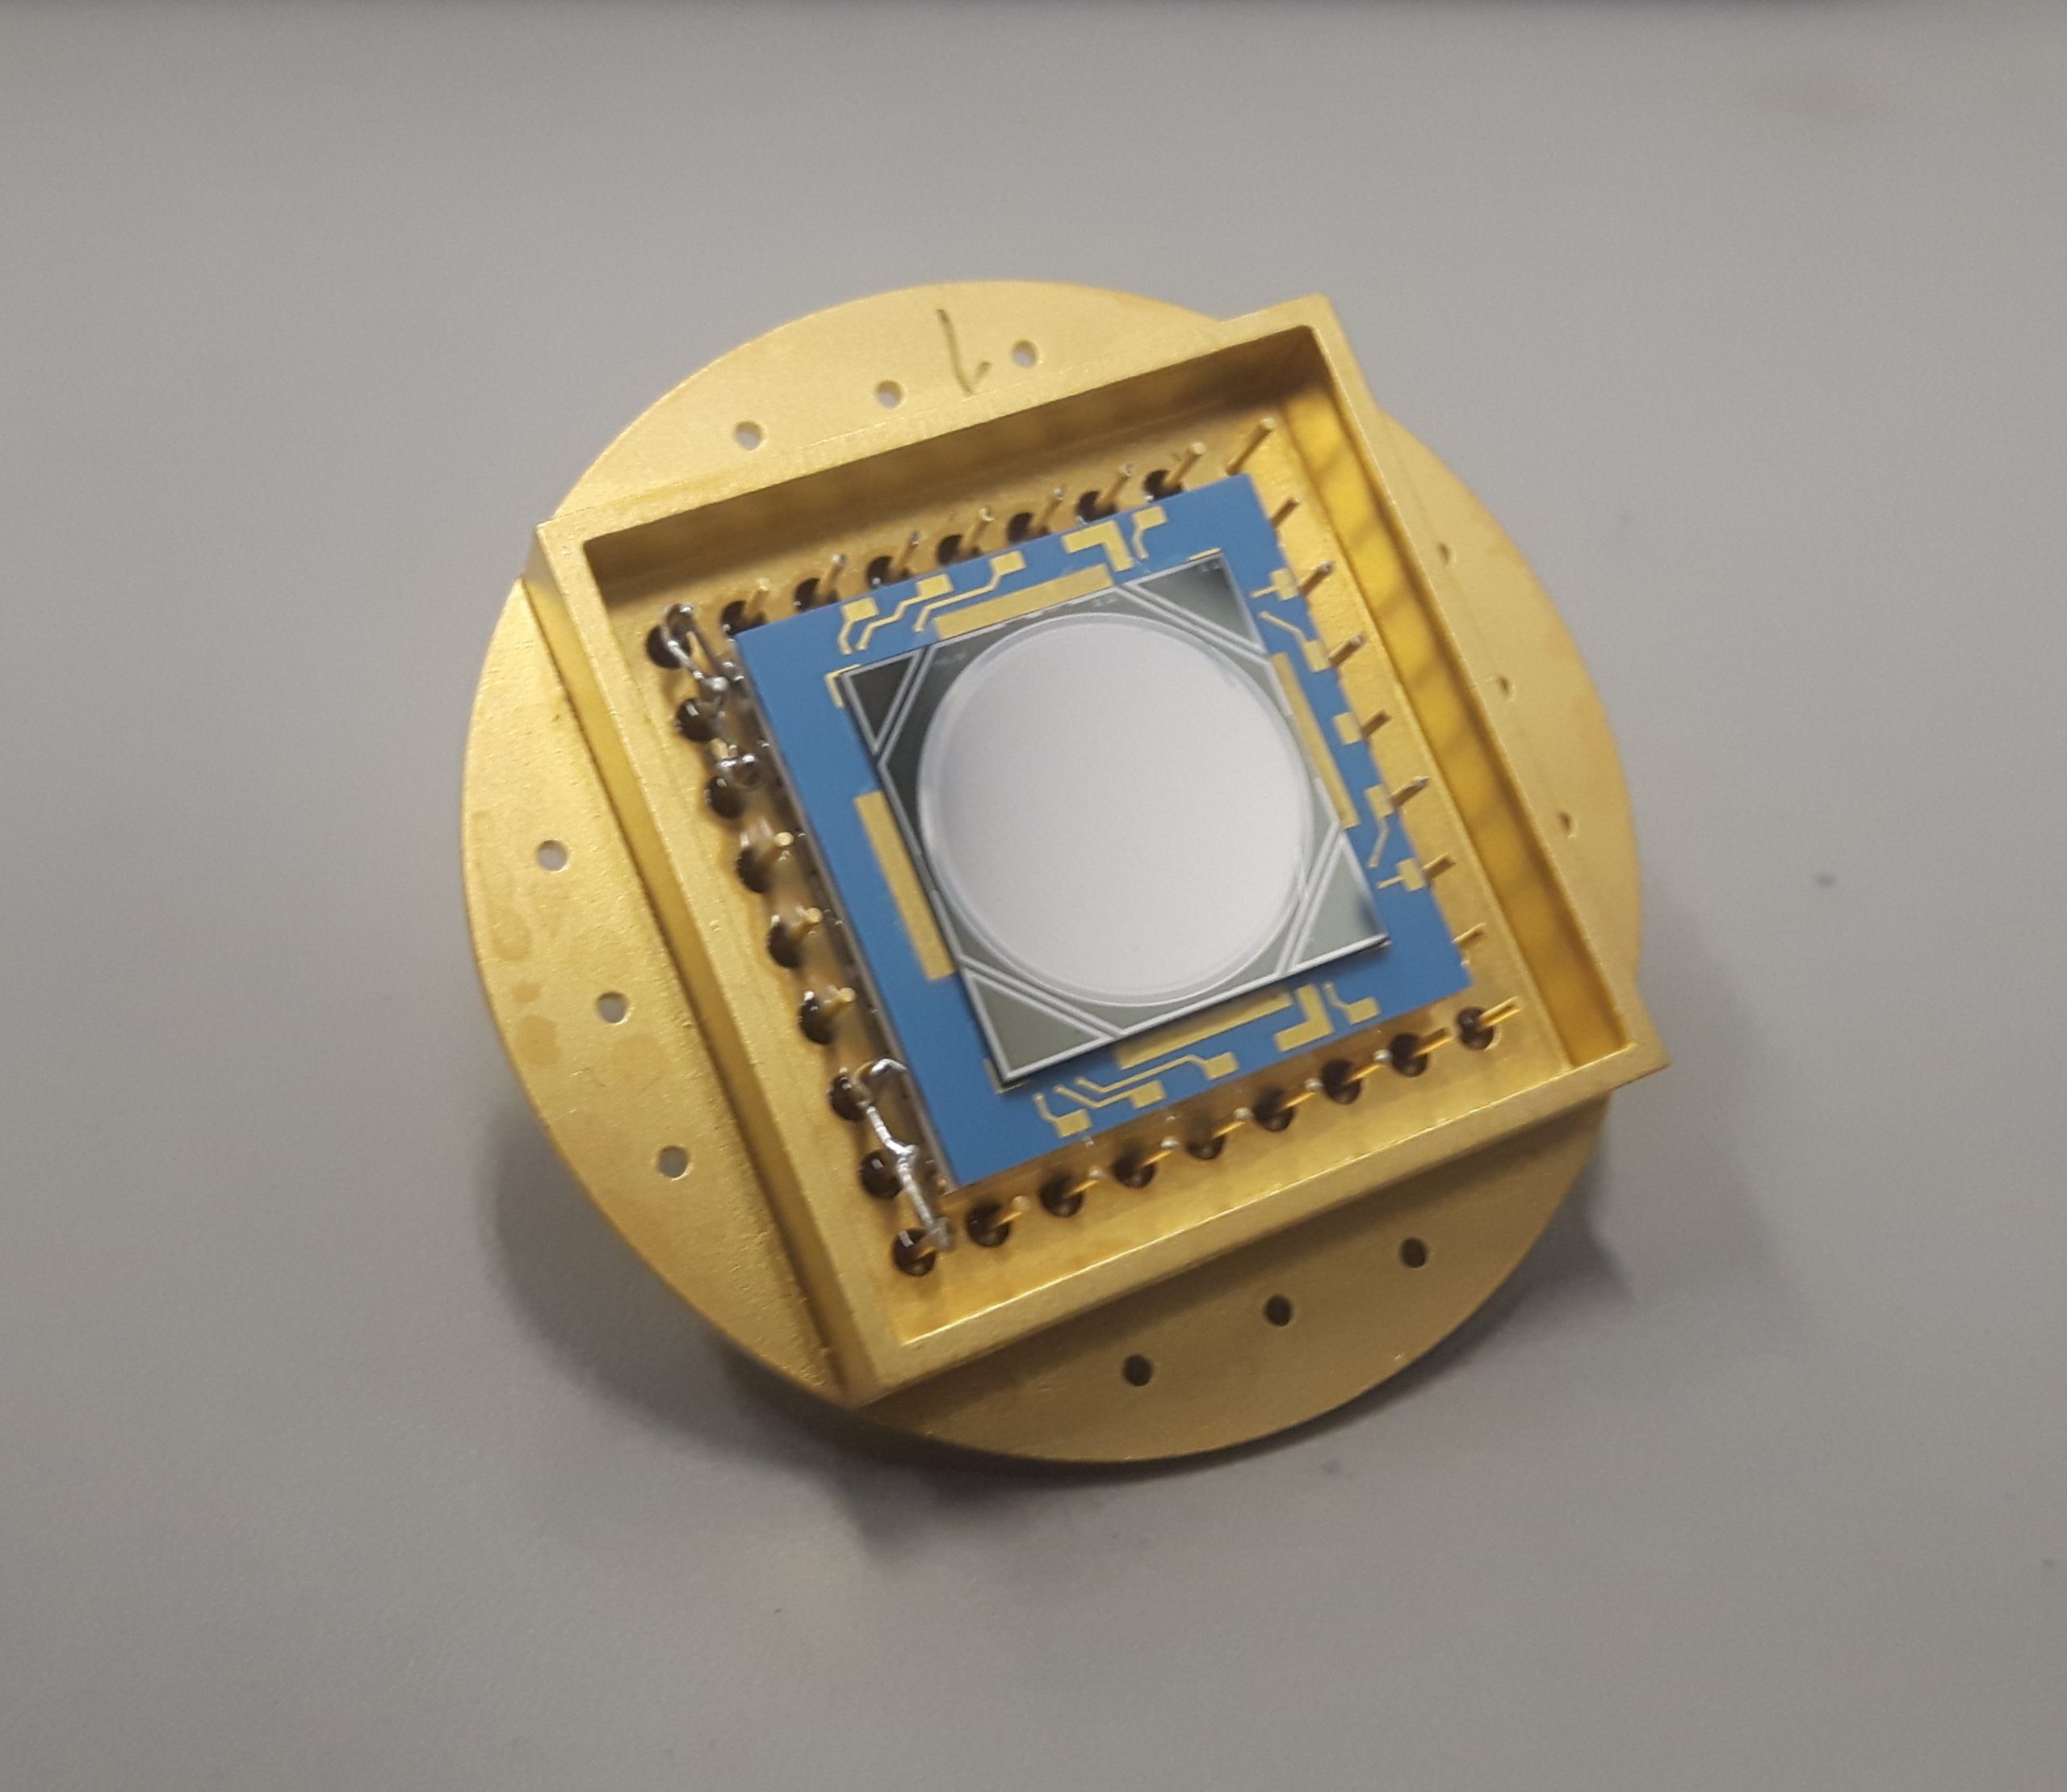
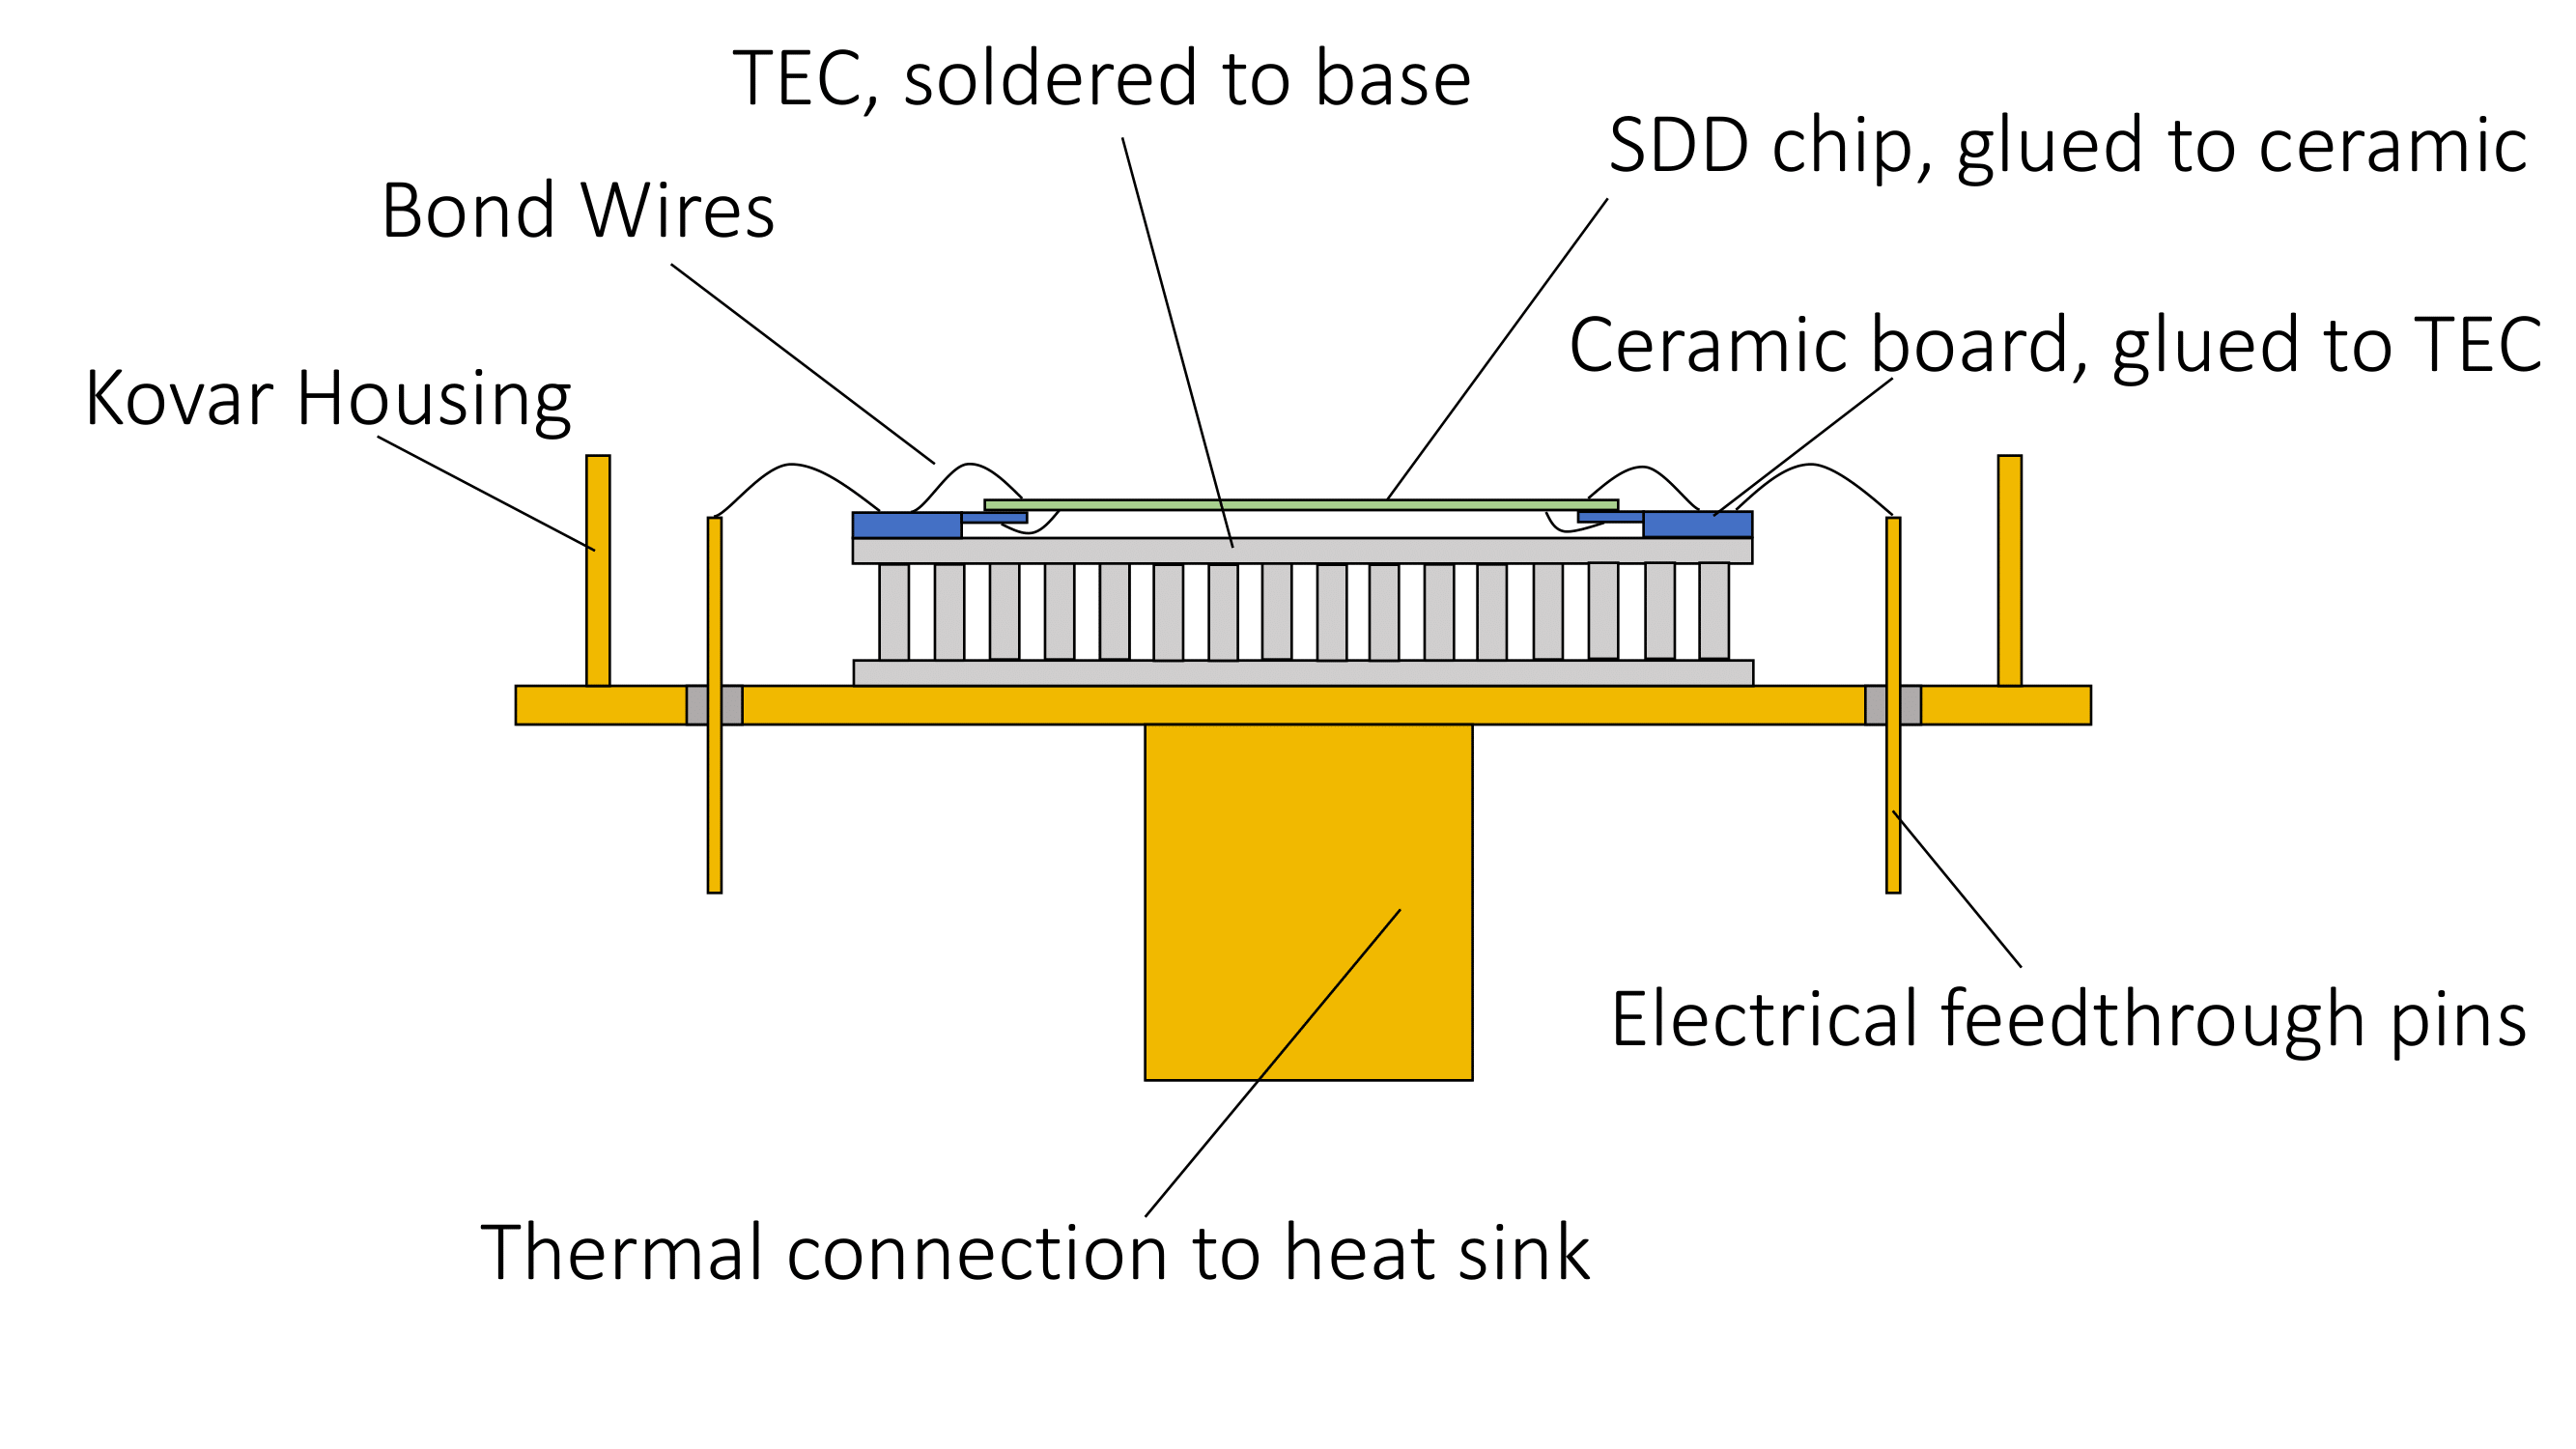
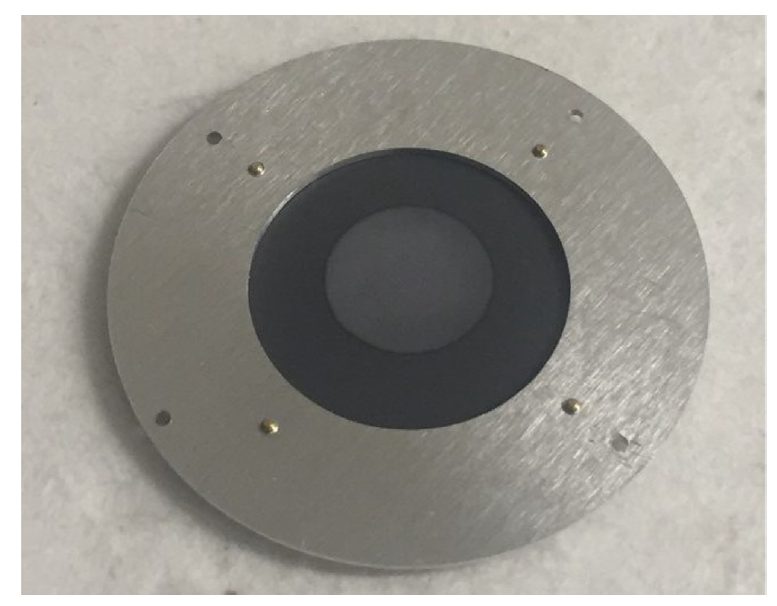
Caption: 40K source, Figure 8 in 2021 KDK publication. | The outer detector is the Modular Total Absorption Spectrometer (MTAS) from the Oak Ridge National Laboratory (ORNL). MTAS is a near one tonne NaI crystal scintillator detector created to detect complex 𝛽 decays from nuclear fission. Due to using NaI crystals, MTAS will have 40K contributions to its background in addition to environmental contributions and cosmogenic particles. The background of the outer detector on its own has been well characterized and is accounted for (see Figure 3 in the 2021 KDK publication). MTAS has 4 main layers: Outer, Middle, Inner, and Central. MTAS has a 63.5mm diameter column in the Central layer, in which the KDK inner detectors are located. For the KDK inner detector, the composite method consists of a large area silicon drift detector (SDD) and a 40K (or other radioactive isotope) source. When interacting with ionizing radiation such as X-rays and Auger electrons, output signal electrons are released within the SDD and indicate a signal. The SDD is cooled, resides in a housing that ensures it is centred with the Central layer of MTAS, and is placed such that it is consistently 1mm away from the source. The SDD energy scale was calibrated using four different sources (54Mn, 65Zn, 88Y, and 40K with the signal region blinded) and was shown to easily achieve its target for measuring 40K X-rays with a 200eV resolution. The restrictions for the 40K source are that it should contain approximately 1018 atoms of 40K (two bananas worth) and be less than 10 µm thick to avoid reabsorption of the emitted X-rays. The thin film source was successfully created using thermal deposition of enriched potassium chloride (KCl) with an efficiency of 30 – 50%. |
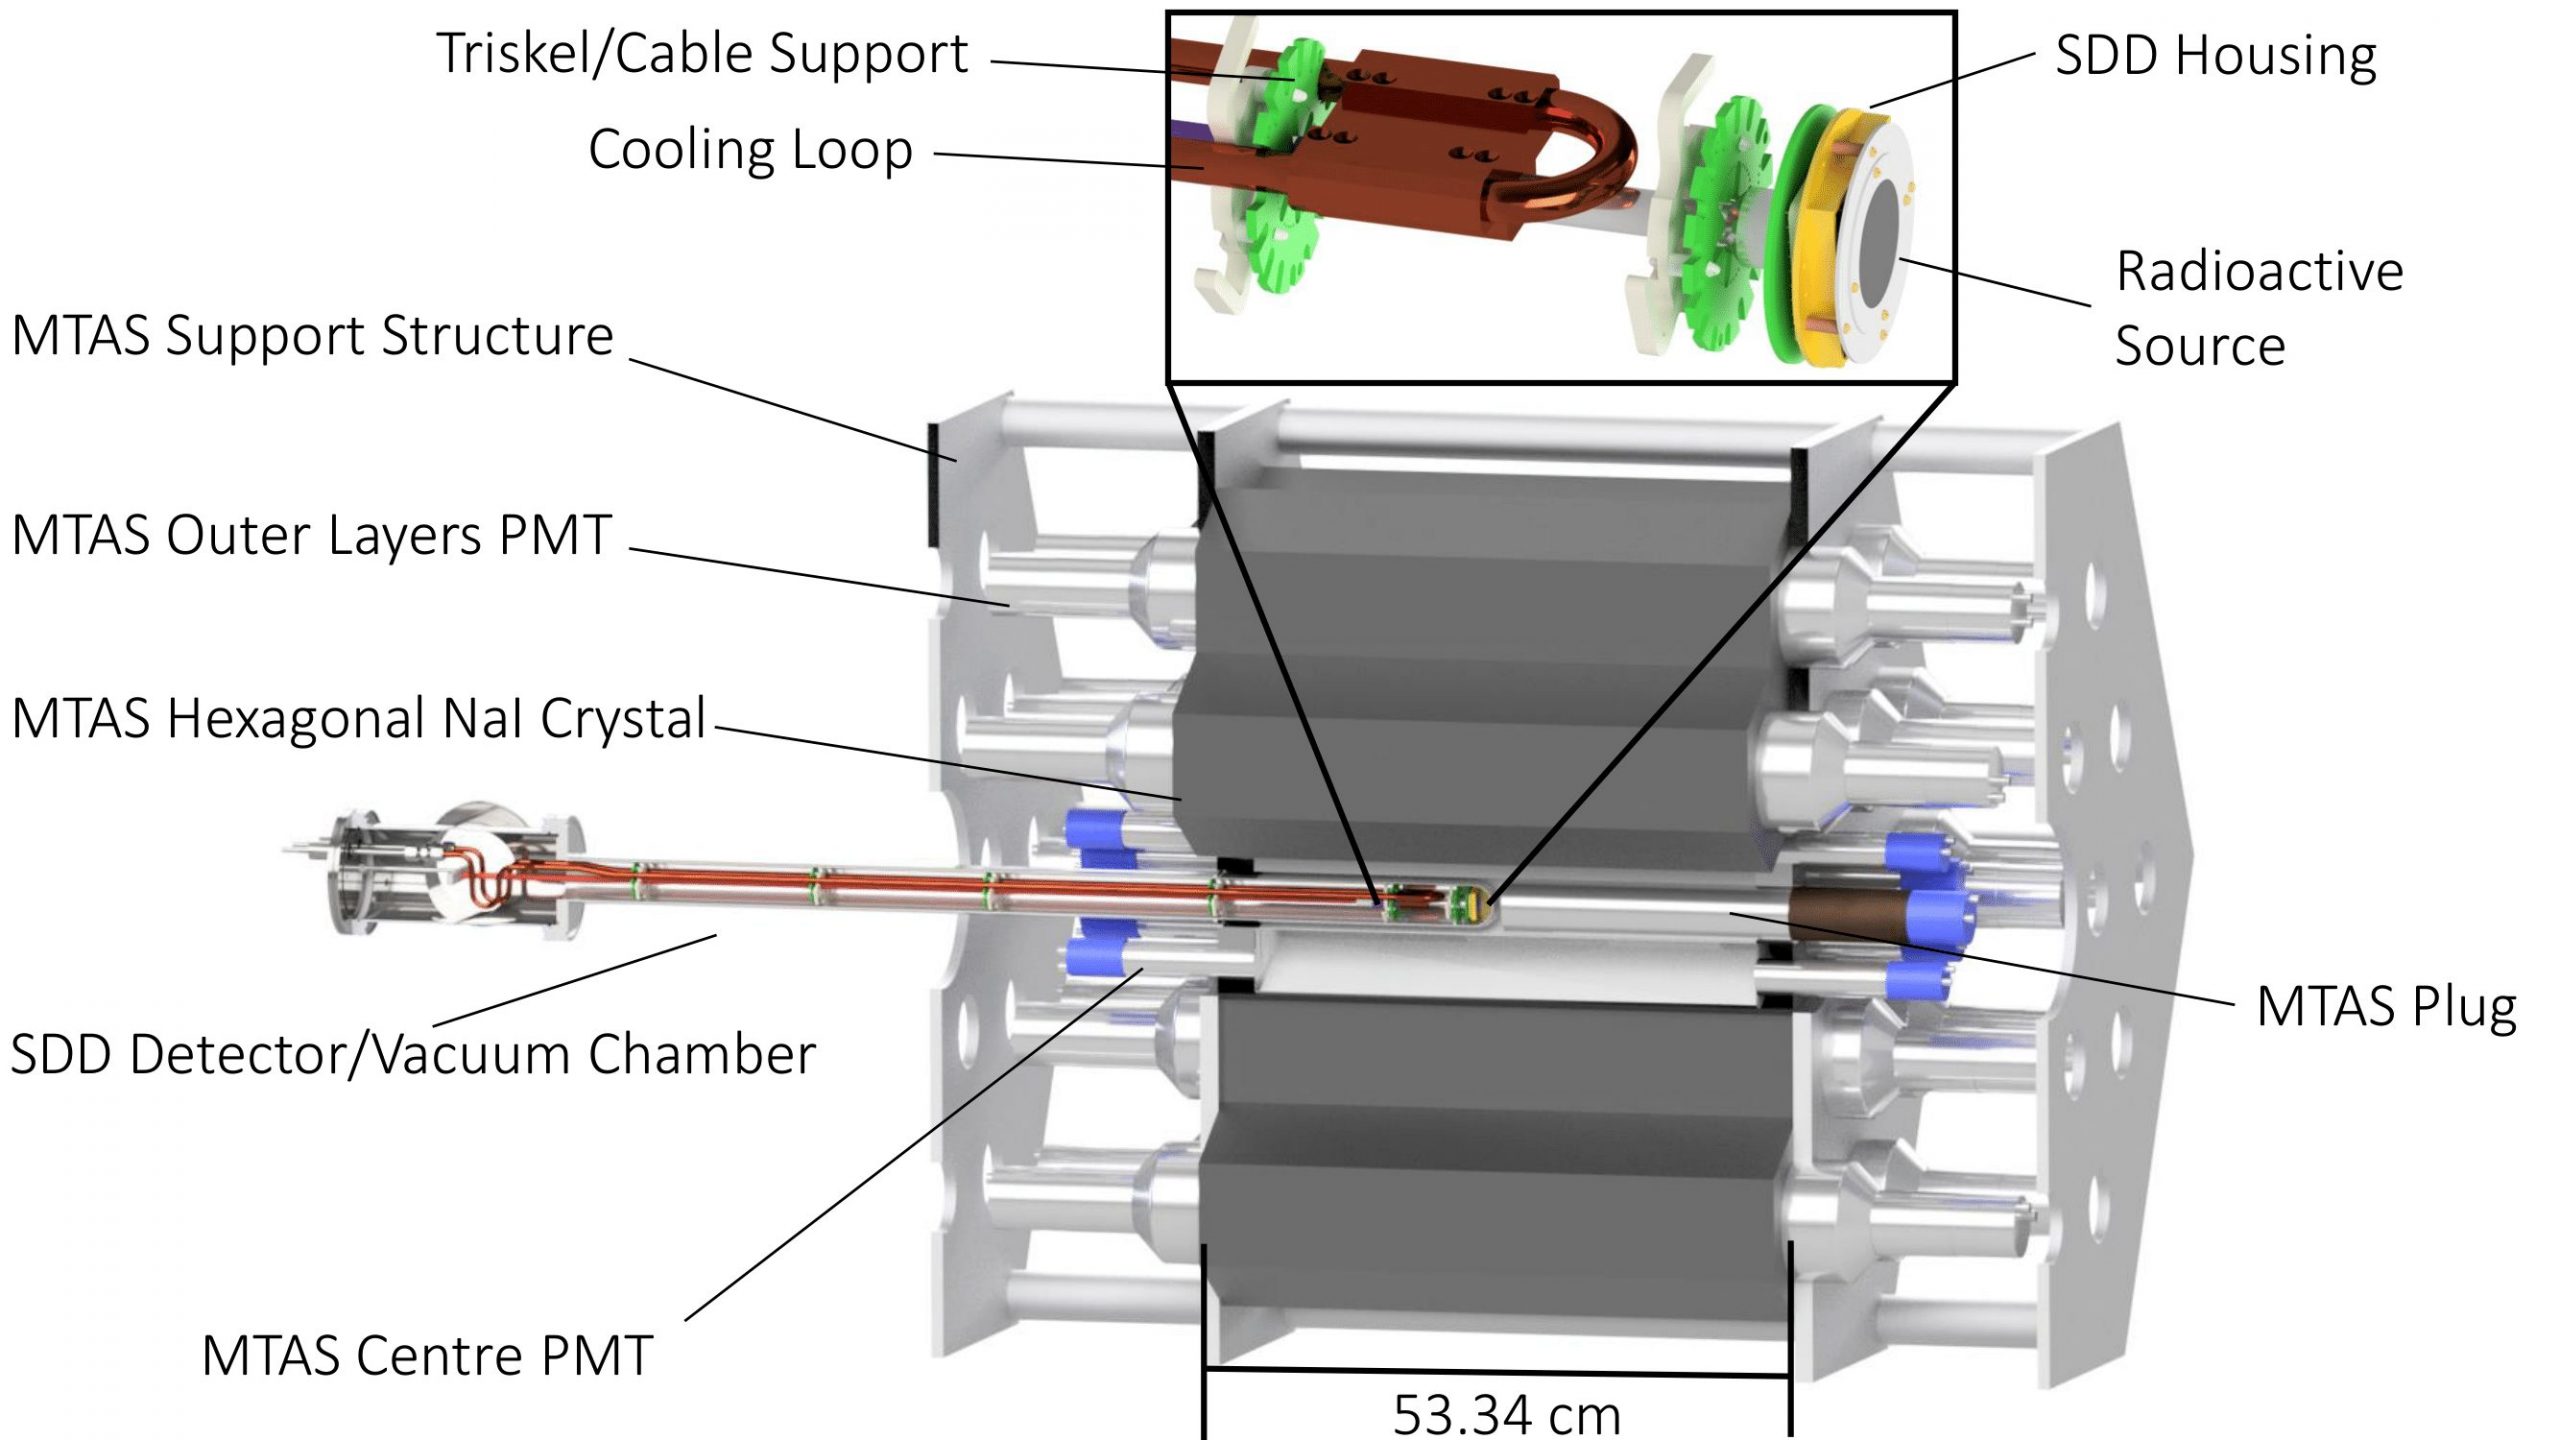
Caption: Schematic of the full KDK experiment, with a zoom in of the inner detector and source. Figure 6 in 2021 KDK publication.
With the SDD successfully integrated into MTAS, the coincidence spectrum and gamma ray tagging efficiency of the KDK experiment were investigated.
The coincidence spectrums represent the coincidence between an X-ray being detected in the SDD inner detector and a corresponding gamma ray being detected in MTAS the outer detector. Various scenarios are captured in the coincidence spectrum, such as not fully captured gamma rays due to Compton scattering and Auger electrons interacting in the SDD simultaneously as gamma rays in MTAS. For the 65Zn and 54Mn sources, the main coincidence peaks corresponding to the electron capture decay channels similar to that of the 40K decay channels are clearly discernible. Both coincidence spectrums can be seen below.
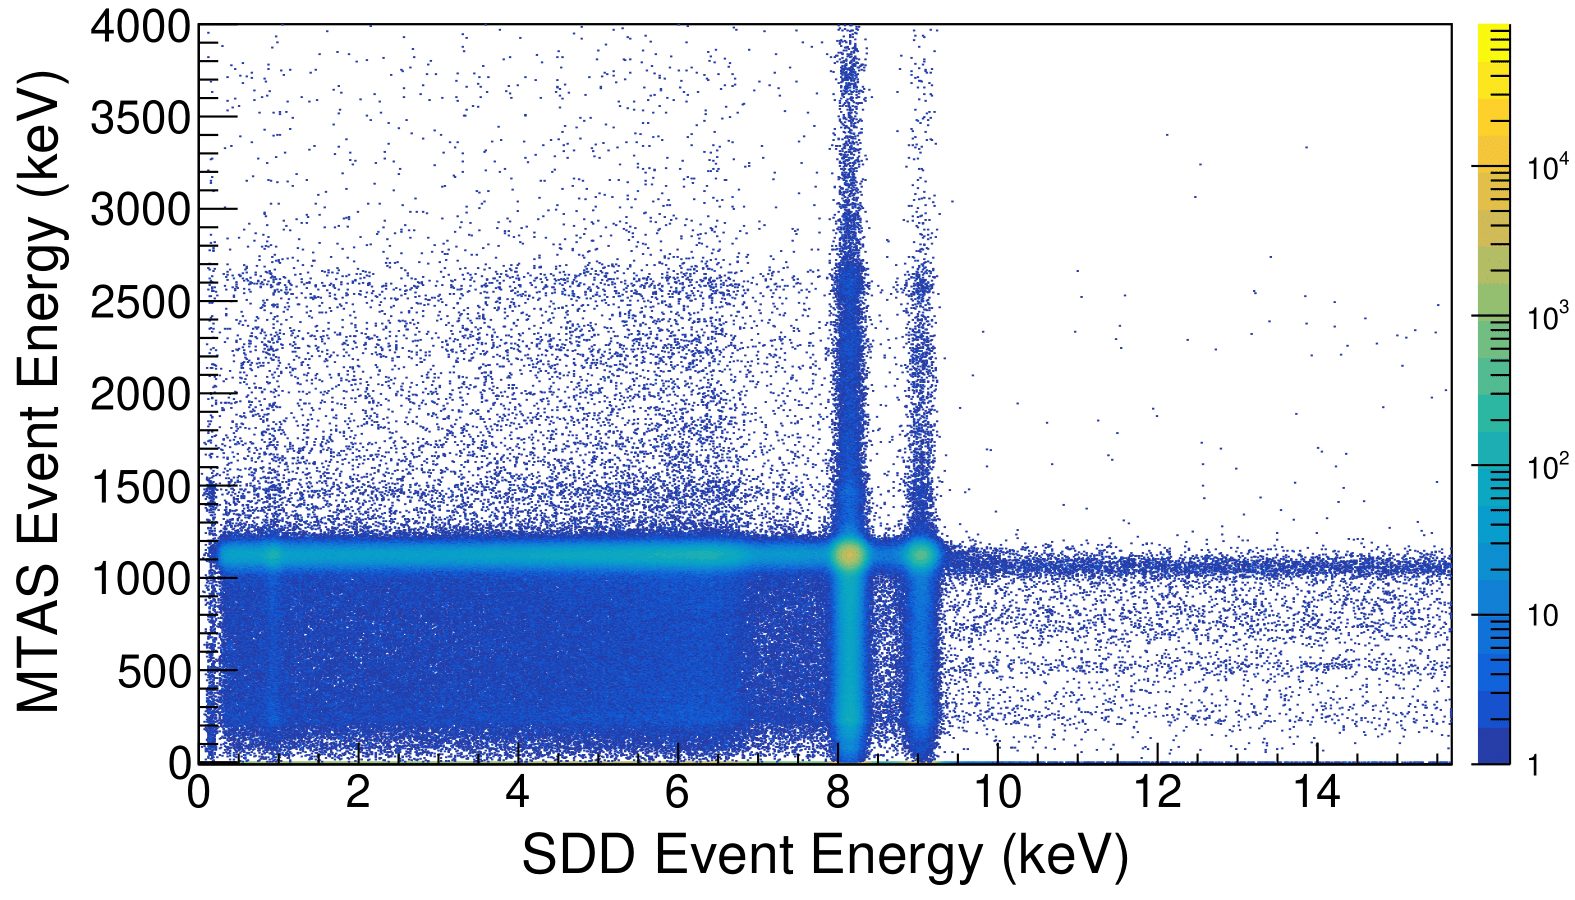 Caption: Coincidence spectrum for 65Zn for the 2 µs window. The colour represents counts per bin, with the clear yellow ‘cross-sections’ indicating the main coincidence peaks. (Figure 17 in the 2021 KDK publication) | 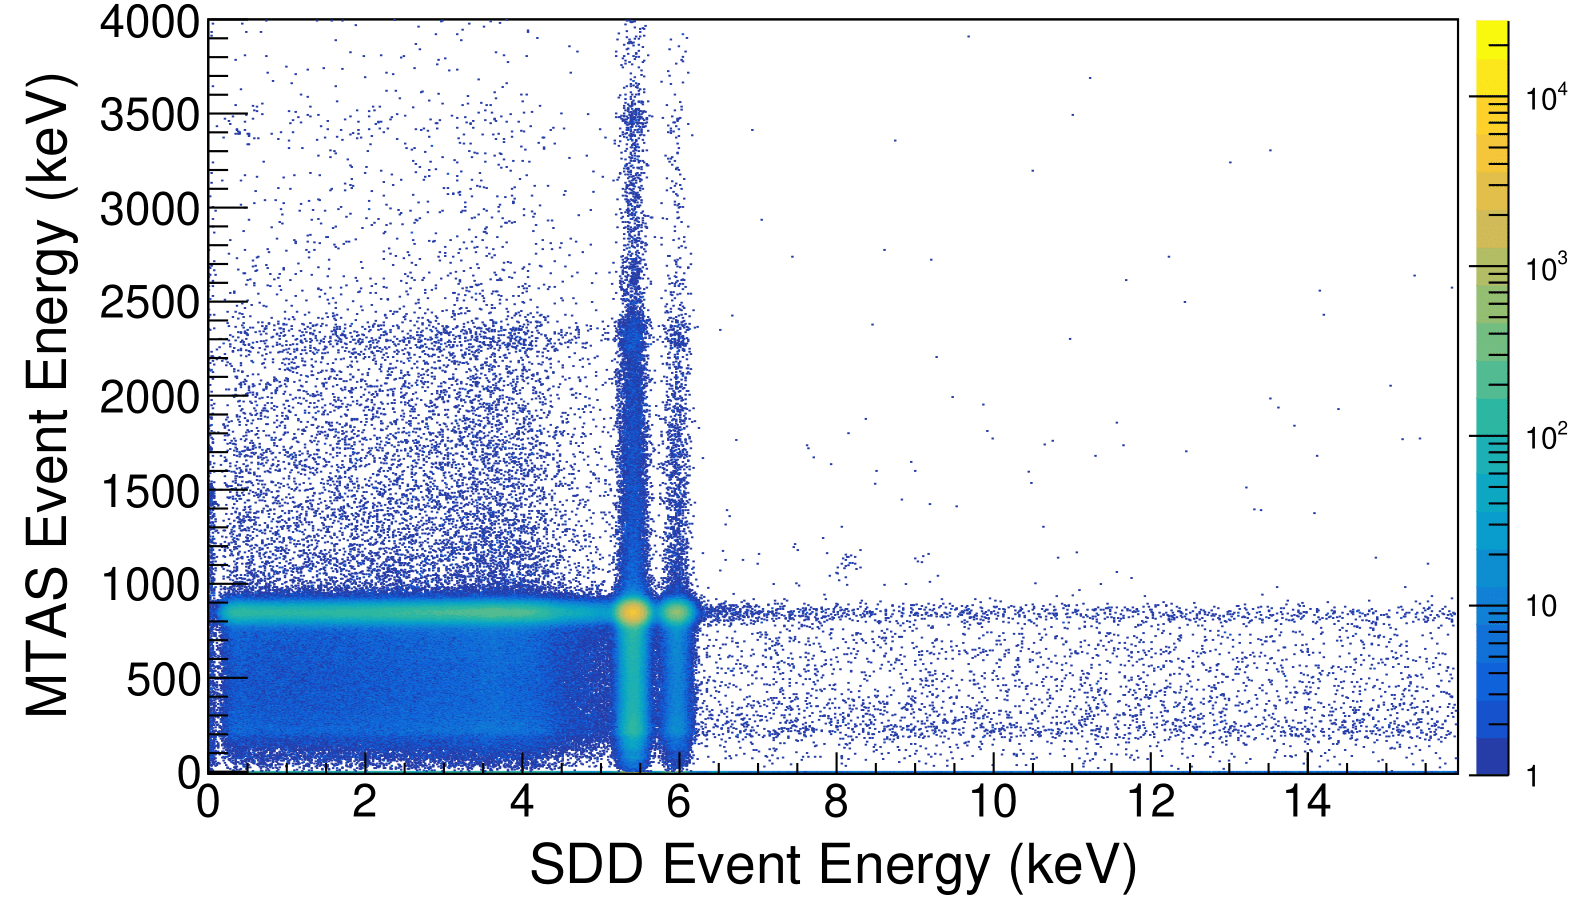 Caption: Coincidence spectrum for 54Mn for the 2 µs window. The colour represents counts per bin, with the clear yellow ‘cross-sections’ indicating the main coincidence peaks. (Figure 18 in the 2021 KDK publication) |
54Mn was used to determine the gamma tagging efficiency of the KDK experiment. This measurement represents the probability of MTAS detecting the gamma ray triggered by an X-ray or Auger electron detection in the SDD. The analysis was performed for different coincidence windows, but in all cases the efficiency was found to be above 97.75%. However, the energy of the gamma ray in the 54MMn electron capture decay channel is 835keV, which is much lower than the 1460keV of the 40K dominant electron capture decay channel. The estimated efficiency for the 40K decay was found by extrapolating the measured 54Mn efficiency using Geant4. The estimated gamma tagging efficiency for 40K from this extrapolation is 97.89(6)%.
With other parameters accounted for in rigorous detail, the testing of the composite method for the KDK experiment confidently shows that it can easily achieve its design goals. With the analysis presented in the 2021 KDK publication, it is expected that the branching ratio will be measured to within 15% at a 68.3% confidence level if it is close to 0.2% (i.e. close to the upper calculated bound).
A 44 day physics run has already been completed with the thermally deposited 40K source, and the analysis is underway. With the fantastic work and rigour put into the experiment and detailed documentation by the KDK collaboration, we look forward to seeing the results in a near-future publication!