NEWS-G moves into next phase and passes a major milestone
After passing the Operation Readiness Review at SNOLAB and the final walk-through of the experiment on August 10th 2021, NEWS-G received the all-clear to begin operations. Shortly thereafter, NEWS-G recorded its first particle interaction.
2 minute read
NEWS-G (New Experiments with Spheres-Gas) finished installation at SNOLAB earlier this year, and recently passed the SNOLAB Operation Readiness Review; a rigorous, evidence-based collection of assessments that look for blind-spots in the planned operations of experiments. After a final walk through, NEWS-G moved into the commissioning phase on August 10th 2021.
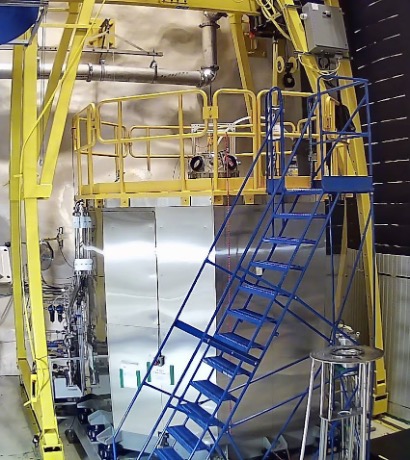
Caption: The NEWS-G detector in the Cube Hall at SNOLAB. The 1.4m diameter copper sphere is enclosed in a shield of lead and high density polyethylene, covered with stainless steel sheets for fire protection. Credit: NEWS-G Collaboration
As the 1.4m Spherical Proportional Counter (SPC) was being filled with a mixture of Argon and Methane for testing, the detector saw its “first light”. “First light” refers to the very first detection of a particle interaction, and references the light given off by these interactions in experiments that use scintillating material for detection. For NEWS-G, “first light” is more accurately described as “first ionization” since the detection is of the ionization of noble gas atoms by the interaction with an incoming particle.
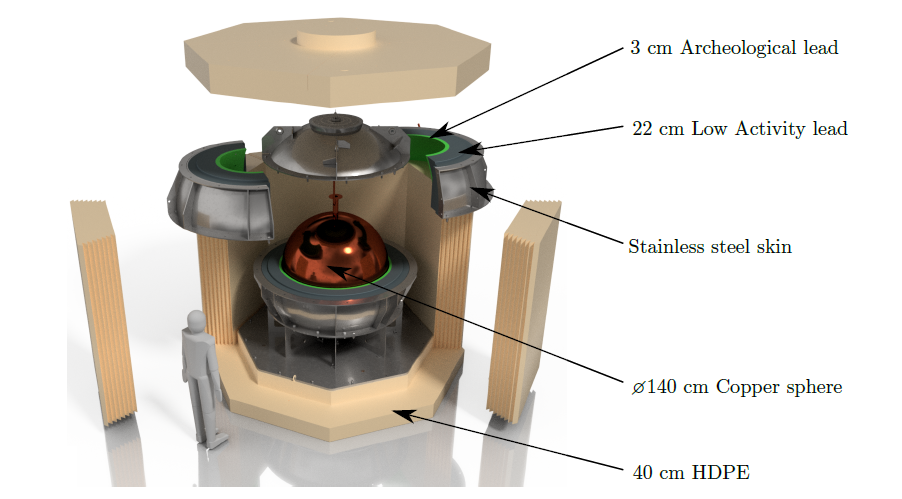
Caption: Exploded view of the detector to be installed at SNOLAB. Credit: NEWS-G Collaboration.
The design of NEWS-G is based on the SPC being filled with a noble gas mixture with a small sensor at the centre. This small sensor is supported by a grounded copper rod and pushed to a high voltage to encourage charge collection. When neutrinos or other weakly interacting particles scatter elections and ionize the noble gas atoms, the electrons drift towards the sensor and cause secondary ionizations which result in an avalanche effect of election-ion pairs. The secondary ions constitute most of the signal.
[expand title=”Video Description” tag=”p”]
The video below shows a cross section of an SPC in the axial symmetry plane, together with the electric field structure on the left and 3 time dependent graphs stacked on the right showing Induced Charge, Induced Current, and Amplifier Signal from top to bottom. All three graphs have a vertical axis that ranges from 0-2.25. On the right side of the SPC an interaction occurs and particles in dark blue leaving behind light blue trails move towards the rod and sensor in the centre of the SPC. At 8 seconds, the particles speed up and the frame zooms in on the sensor in the SPC as large red dots appear on the sensor. At the same time, the Induced Current spikes and the Amplifier Signal and Induced Charge begins to increase. At 12 seconds, the zoom is complete and we see that the red dots on the sensor are a build up of ionized noble gas atoms that continue to pile onto the left side of the sensor. The Induced Current is variable between 0.1-1, the Amplifier Signal is increasing steadily and at about 1, and the Induced Charge is increasing more slowly and at about 0.3. After 12 seconds, the ions continue to pile onto the sensor but the Induced Charge flattens out at 0.5, the Induced Current drops back to 0, and the Amplifier Signal slowly decreases and reaches 0 at about 17 seconds. During this time, the frame on the SPC is zooming back out to a full view, showing the red ions on the sensor and the blue trails left by the particles earlier on. The video continues to 24 seconds, showcasing how the three graphs appear with additional data.
[/expand]
Credit: Philippe Gros, NEWS-G Collaboration
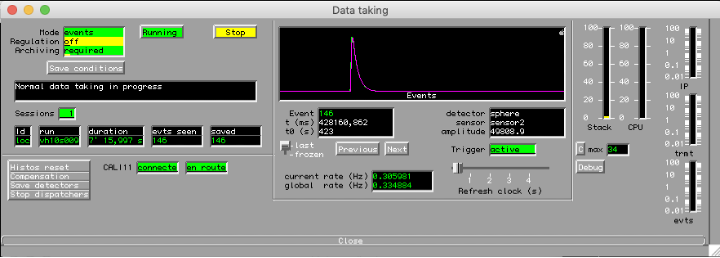
Caption: The data acquisition display, showing one of the first pulses observed with the NEWS-G detector at SNOLAB. Credit:NEWS-G Collaboration
The first detection at NEWS-G is a major milestone, and showcases the ability of the detector. In the coming weeks, NEWS-G will undergo characterization and optimization campaigns before being filled with a mixture of Neon and Methane that will provide the best sensitivity for low mass dark matter detection. After the following calibration campaign, NEWS-G will begin its search for light dark matter particles.
Congratulations to the NEWS-G group for passing this huge milestone!